- Expert advice/
- Wedding trends/
- First Look Reports/
- The First Look Report 2023 Deep Data Dive
- First Look Reports
The First Look Report 2023 Deep Data Dive
Zola surveyed over 4,000 couples on their planning journeys to find out what’s shaping 2023.
Last updated February 5, 2024
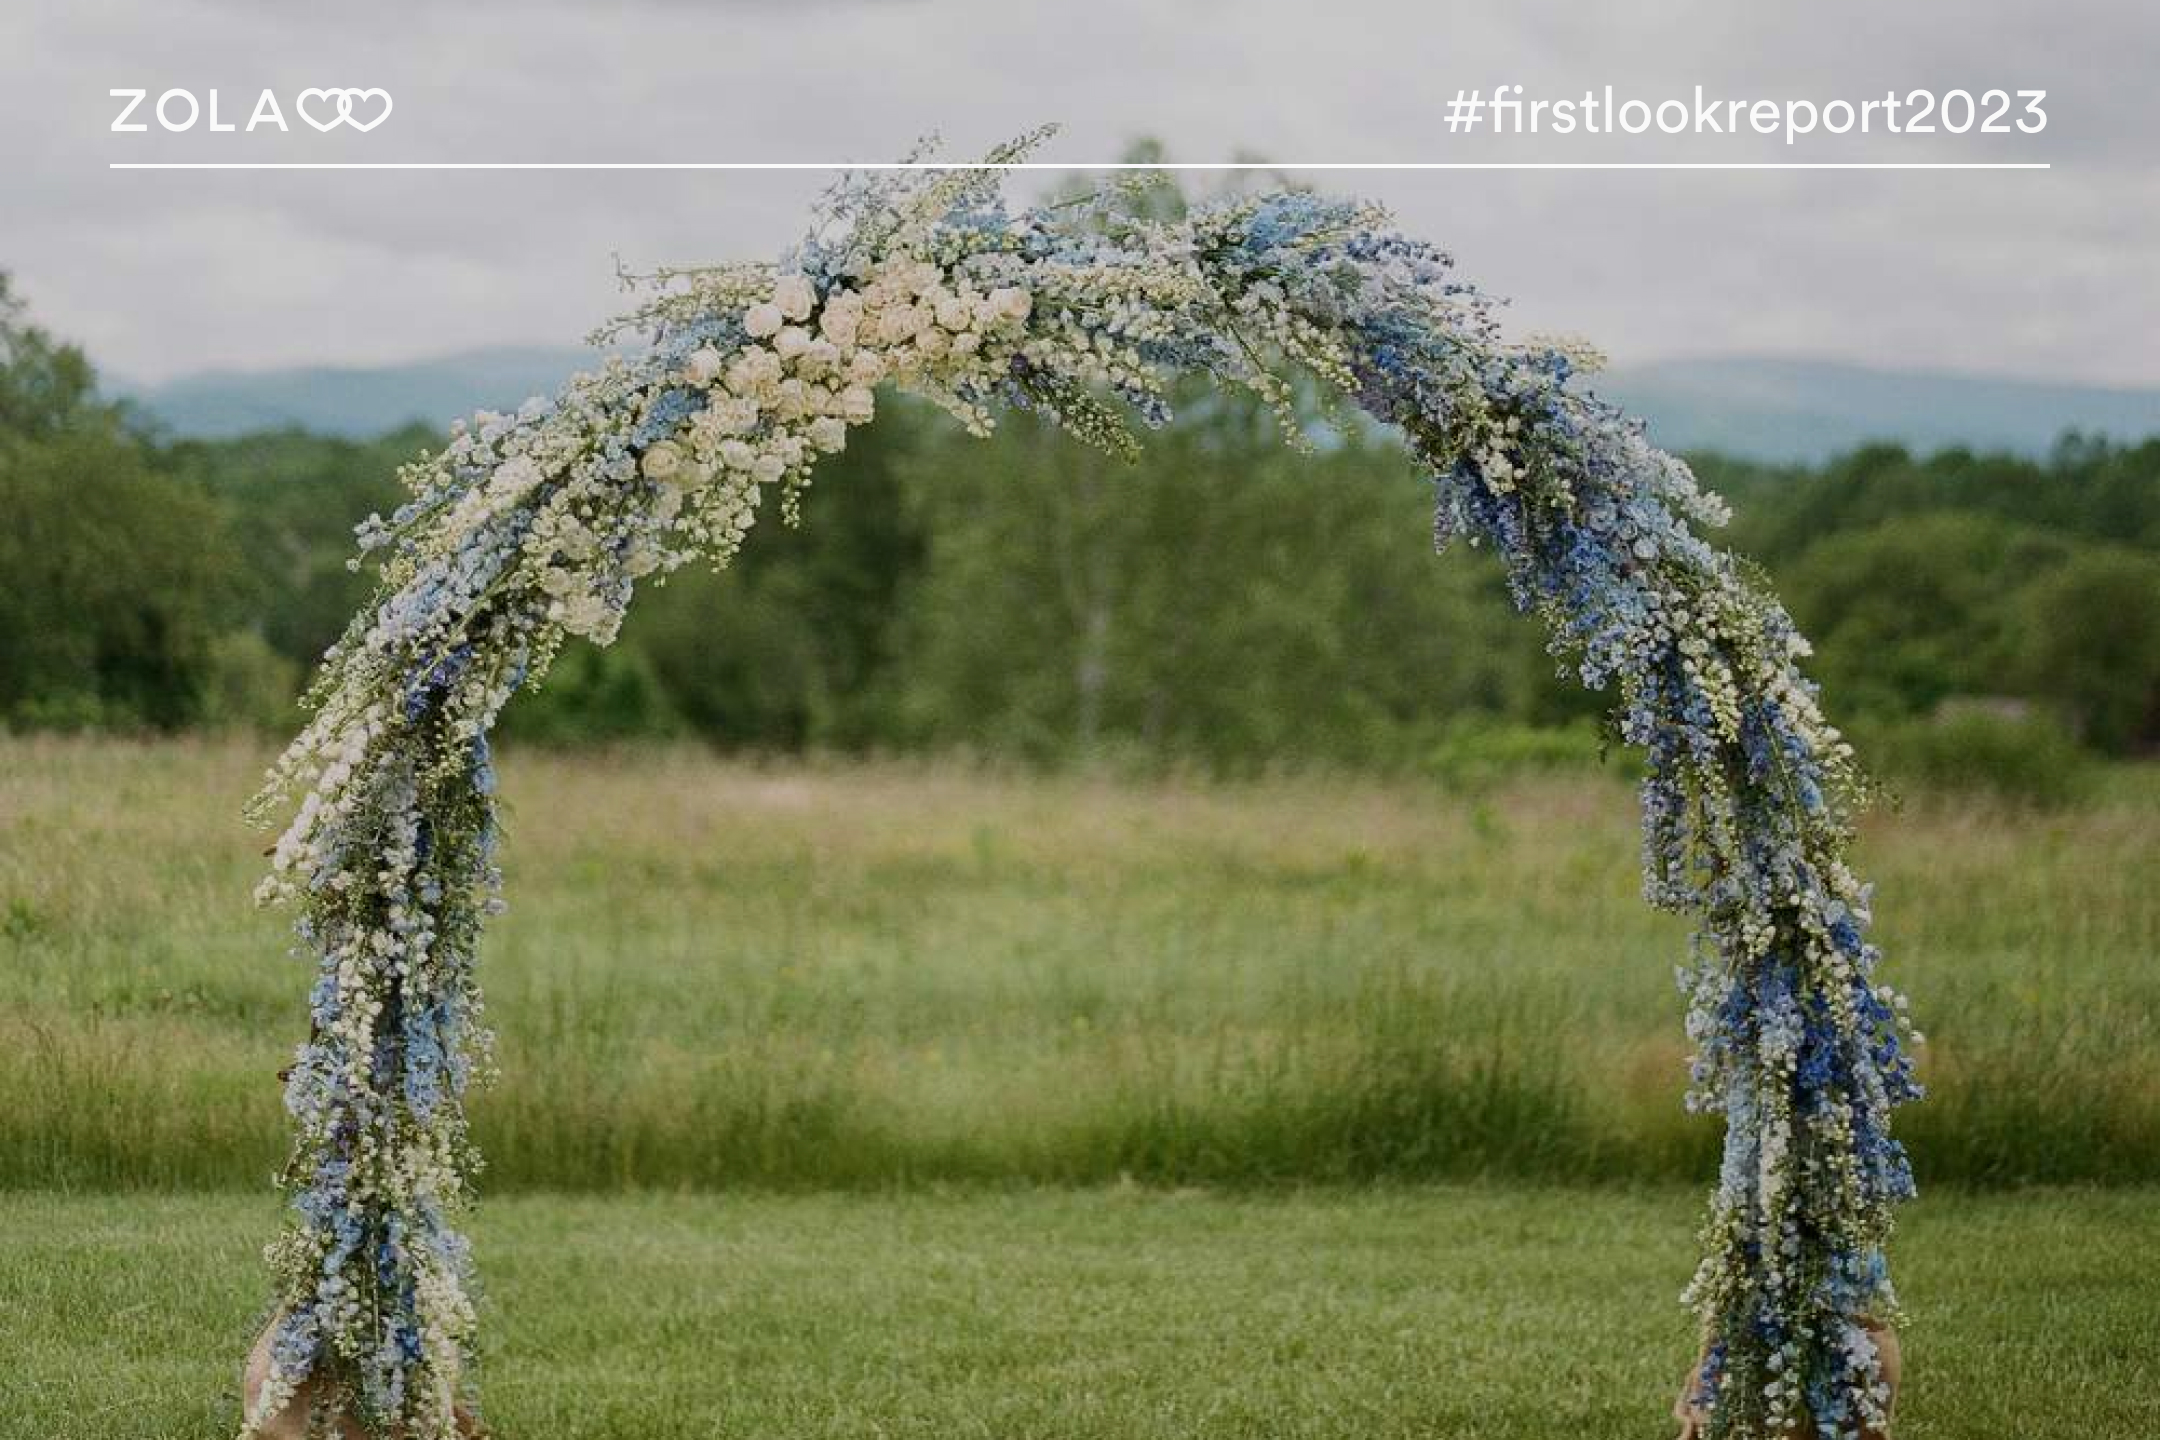
The First Look ✨
- The Relationship & Wedding: How long 2023 couples have been engaged, how they met their partners, and more.
- The Wedding Journey: Which wedding events couples are having, how much time goes into the planning process, and all the feels along the way.
- The Inspo & Mindset: Where couples are finding their wedding inspiration, how imporant it is to be "unique", and how social media plays a roll in planning.
- The Values & Traditions: What really matters to couples planning their weddings, what's most important when choosing "the one", and more.
- The Finances & Budget: 2023 Wedding budgets, who's all contribuiting, and what couples are splurging on.
If you’ve read our First Look Report 2023, then you know about the overall trends for this year. Couples getting married in 2023 have shaken off preconceptions about what a wedding should be, and they’ve been inspired to plan weddings that feel personalized & authentic to who they are. They’re finding inspiration in new places, seeking a sense of community during this milestone lifestage, and also spending their money wisely. Ultimately, these couples know that the wedding is just one (really fun) part of the journey.
Here’s a closer look at alllllllll of the data:
The Relationship & Wedding
2023 couples are together for a loooooong time before they get married (and even before they get engaged), meaning the decision to get married in 2023 is more intentional than for any set of couples before.
What month are you getting married?
- January: 3.34%
- February: 4.93%
- March: 7.23%
- April: 10.96%
- May: 13.33%
- June: 13.35%
- July: 8.56%
- August: 7.28%
- September: 13.42%
- October: 11.37%
- November: 4.59%
- December: 1.48%
- Undecided: 0.17%
How long will you have been engaged by the time you get married?
- <6 months: 1.69%
- 6 - 8 months: 3.60%
- 9 - 11 months: 8.59%
- 12 months: 8.52%
- 13 months: 5.35%
- 14 months: 8.00%
- 15 months: 8.42%
- 16 months: 7.34%
- 17 months: 6.38%
- 18 months: 9.58%
- 19 months: 3.07%
- 20 months: 3.51%
- 21 months: 2.09%
- 22 months: 2.14%
- 23 months: 1.87%
- 2 years: 10.02%
- 3 years: 2.95%
- 4 years: 1.28%
- 5+ years: 3.77%
How long will you have been with your partner by the time you get married?
- <1 year: 0.85%
- 1 year: 2.24%
- 2 years: 10.44%
- 3 years: 15.95%
- 4 years: 16.93%
- 5 years: 14.42%
- 6 years: 11.94%
- 7 years: 9.12%
- 8 years: 6.19%
- 9 years: 3.98%
- 10+ years: 7.94%
Where is your wedding taking place?
- Local to where I currently live: 55.03%
- Local to my or my partner’s hometown: 17.77%
- In another domestic location other than where we currently live / are originally from: 18.19%
- In an international location: 5.76%
- In multiple locations (e.g., ceremony in one city/state/country, belated reception in another): 1.75%
- Still deciding: 1.51%
How did you decide on your wedding location?
- Searched online for venues: 42.58%
- It’s where we currently live: 17.88%
- It’s where one of us grew up: 15.26%
- Destination spot we love: 14.59%
- Found our location through social media: 8.55%
- Picked our venue even before we got engaged: 6.66%
- We had been to the venue as wedding guests: 5.10%
- Our wedding planner picked the location: 1.09%
- Still deciding: 3.44%
- Other: 10.23%
Before getting married you and your partner will have…
- Lived together: 86.79%
- Combined finances: 37.99%
- Bought a home: 30.65%
- Gone through couples therapy or pre-marital counseling: 25.74%
- Shared debt: 19.57%
- Made another big purchase (e.g., car): 18.45%
- Had child(ren) (together or separate): 12.18%
- Broken up and gotten back together: 8.91%
- Been in a previous marriage: 8.74%
- Signed a prenuptial agreement: 6.96%
- None of the above: 3.77%
How did you and your partner meet?
- At school: 27.70%
- Through an online dating service or app: 27.21%
- Through friends: 19.63%
- At work: 11.19%
- At an event (e.g. wedding, fundraiser, etc.): 4.16%
- Other: 10.12%
All the Days Along the Way: The Wedding Journey
Wedding planning is filled with tons of conflicting emotions, and while it’s mostly very fun and exciting it’s also overwhelming and couples feel they don’t know where to begin. With so many events, there’s so much to plan and couples are doing it whenever they can – but they’re still finding time to celebrate the small wins, bond with their partner, and get support from their communities.
Which wedding-specific events are you planning?
- Reception: 97.91%
- Ceremony: 96.92%
- Rehearsal dinner: 66.60%
- Bach party: 56.51%
- Wedding shower: 43.36%
- Reception after-party: 27.19%
- Goodbye brunch: 24.70%
- Welcome party: 24.16%
- Engagement party: 18.54%
- Specific cultural event: 2.16%
- Other: 1.79%
Are you planning a sequel wedding (either ceremony, reception, or both)?
- Yes: 15.51%
- No: 77.72%
- Considering it, but not sure yet: 6.77%
Which has been or do you expect to be your favorite wedding planning moment?
- Getting engaged: 39.57%
- Feeling DONE with all of the planning: 29.43%
- Saying “yes” to our wedding attire: 26.12%
- Our engagement photoshoot: 23.04%
- Sharing the news with family & friends: 22.63%
- Our food tasting: 15.82%
- Choosing our venue: 14.42%
- Picking out our wedding decor (flowers, balloons, etc.): 12.72%
- Practicing our first dance: 12.02%
- Getting our marriage license: 11.94%
- Creating our playlist: 11.55%
- Our cake / dessert tasting: 7.95%
- Designing our save the dates or invites: 7.79%
- Putting our invites in the mail: 7.43%
- Selecting our wedding registry gifts: 6.86%
- Getting our first RSVP: 6.80%
- Creating our wedding website: 5.55%
- Picking our date: 5.32%
- Practicing our first kiss: 3.49%
- Posting about our news on social media: 3.36%
- Getting our first wedding gift: 2.74%
- A special cultural moment: 1.93%
- Creating our budget: 0.99%
Did you celebrate accomplishing any of these particular pivotal wedding planning moments in any way?
- Yes: 68.08%
- No, but I wish we had: 22.02%
- No, and I wouldn't want to: 9.90%
How did you celebrate these moments?
- Cheers / bubbles / special drink: 59.91%
- Night out with your partner: 49.41%
- Some rest & relaxation: 35.74%
- Delicious treat: 24.18%
- Time off from wedding planning: 19.98%
- Just a high five: 16.61%
- Self-care (got a manicure, a massage, etc.): 14.42%
- Bought yourself something you really wanted: 6.97%
- Dance party: 6.74%
- Vacation: 3.49%
- Other: 4.78%
What words would you use to describe wedding planning?
- Exciting: 70.76%
- Overwhelming: 59.28%
- Stressful: 52.78%
- Fun: 50.45%
- Special: 45.05%
- Full of love: 36.81%
- Exhausting: 31.01%
- Joyful: 29.29%
- Grateful: 26.11%
- Nervous: 25.98%
- Surprising / Unexpected: 25.90%
- Inspired: 14.13%
- Amusing / Funny: 10.33%
- Absurd / Ridiculous: 10.35%
- Chill: 8.56%
- Neutral: 3.88%
- Other: 2.46%
When are you spending time planning your wedding?
- On the weekends: 57.97%
- During work: 46.21%
- Late at night (e.g., after work or once the kids go to bed): 45.88%
- All the time: 33.01%
- On my lunch break: 27.21%
- During scheduled times that we set as a couple: 20.54%
- In the middle of the night when I can’t sleep: 17.62%
- During meals: 13.63%
- First thing in the morning before work / school: 8.08%
- On my commute: 4.42%
- Other: 5.01%
How has wedding planning affected your relationship with…your partner?
- Our relationship is stronger: 49.93%
- No Impact: 45.65%
- Our relationship is strained: 4.42%
How has wedding planning affected your relationship with…your family?
- Our relationship is stronger: 28.27%
- No Impact: 59.99%
- Our relationship is strained: 11.74%
How has wedding planning affected your relationship with…your friends?
- Our relationship is stronger: 27.54%
- No Impact: 70.05%
- Our relationship is strained: 2.41%
Who has been your “rock” during the planning process?
- My partner: 77.88%
- My best friend(s): 42.63%
- My parent(s) / guardian(s): 36.34%
- Myself: 35.47%
- My pet: 17.56%
- My married friends: 15.06%
- Other family members: 14.36%
- My sibling: 11.29%
- My wedding vendors: 6.32%
- My therapist: 5.05%
- Others in the engaged community (Zola’s community, Facebook communities, etc.): 4.12%
- Social media: 3.45%
- My children: 2.71%
- Religious figure: 2.50%
- Other: 4.04%
How have / are you combating the stress that can come with wedding planning?
- Exercise: 41.20%
- Fresh air & sunshine: 33.84%
- Spending time with friends: 31.93%
- Spending time with pets: 29.92%
- Personal self care (facials, massage, etc.): 26.89%
- Seeking support / venting to other engaged or married couples: 24.20%
- Endlessly scrolling social media: 23.49%
- Food / cooking: 23.11%
- Diving into TV: 21.14%
- Reading: 19.70%
- Sex: 16.49%
- Hiring a wedding planner: 15.61%
- Unplugging from social media / electronics: 15.50%
- Alcohol: 14.09%
- Spending time creating (art, crafts, etc.): 13.76%
- CBD / marijuana: 10.38%
- Going to therapy: 9.92%
- Yoga: 8.96%
- Religion: 7.33%
- Journaling: 6.59%
- Meditation: 6.46%
- The Zola team (Melissa, Team Z, customer service, community): 2.83%
- A new hobby: 1.63%
- Other: 3.62%
- None of the above / I’m not stressed: 6.46%
Are you taking a honeymoon?
- Yes: 82.22%
- No: 1.76%
- Not sure yet: 16.02%
How prepared did you feel to plan your wedding before you started?
- Super prepared, nothing surprised me: 7.00%
- Pretty prepared, but there were some things I didn’t realize: 33.01%
- A little prepared, I had to do some research: 32.57%
- Not at all prepared!: 27.42%
What didn’t you feel prepared for?
- The number of decisions: 70.42%
- Setting a budget: 59.67%
- Vendor hiring, negotiations & contracts: 54.14%
- The amount I’d have to talk about getting married with friends, family, and strangers: 35.92%
- Any family / friend drama: 32.44%
- The commitment that comes with it: 10.72%
- Other: 3.03%
The Inspo & Mindset
With the uptake of social media platforms as wedding planning sources and the increase in weddings attended, 2023 couples are overloaded on wedding inspo by the time they get engaged, leading to a desire to make weddings more authentic, fun, unique, and less contrived and traditional.
When did you start thinking/planning/dreaming about having a wedding?
- Since I was a child: 28.87%
- When my partner and I started thinking / talking about marriage: 19.78%
- When we got engaged: 15.09%
- When I met my partner: 10.92%
- When I started attending other people’s weddings: 10.50%
- When I entered my first serious relationship: 9.53%
- Since I saw my first rom-com: 4.08%
- I still don’t want to think about it: 1.22%
How many weddings have you attended ever?
- 0: 0.95%
- 1: 1.86%
- 2: 5.17%
- 3: 7.23%
- 4: 7.26%
- 5: 12.66%
- 6: 7.71%
- 7: 5.73%
- 8: 5.84%
- 9: 1.97%
- 10: 17.13%
- 11 - 15: 13.29%
- 16 - 20: 6.56%
- 21+: 6.62%
How many weddings have you attended in the past two years?
- 0: 15.05%
- 1: 17.13%
- 2: 18.53%
- 3: 14.33%
- 4: 11.07%
- 5: 8.07%
- 6: 4.84%
- 7: 1.78%
- 8: 2.70%
- 9: 0.53%
- 10: 3.12%
- 11+: 2.87%
Have the previous weddings you’ve attended influenced planning for your own?
- Yes: 80.12%
- No: 19.88%
Has being a wedding guest inspired your own vision to be more…
- Fun: 82.92%
- Authentically us: 81.37%
- Unique / different: 69.58%
- A reflection of our values: 56.55%
- Energetic: 55.21%
- Inclusive / welcoming of all people: 54.96%
- Chill: 37.39%
- Emotional: 35.04%
- Casual: 32.29%
- Fancy: 25.25%
- Traditional: 16.20%
- Religious: 11.06%
Has being a wedding guest inspired your own vision to be less…
- Traditional: 42.61%
- Religious: 37.01%
- Fancy: 30.53%
- Casual: 20.04%
- Emotional: 10.32%
- Chill: 6.58%
- Unique / different: 3.73%
- Inclusive / welcoming of all people: 3.17%
- Energetic: 2.64%
- A reflection of our values: 1.02%
- Authentically us: 0.46%
- Fun: 0.25%
How important is it that your wedding be “unique” or “different” compared to other weddings you’ve seen?
- Very important: 17.57%
- Pretty important: 31.65%
- I don’t care either way: 32.84%
- Not too important: 12.79%
- Not at all important / I have never even thought about it: 5.15%
On a scale of 1 - 4, how much do you care about how your wedding looks and feels?
- 4 - I have strong opinions about every detail: 14.06%
- 3 - I know what I want but am flexible if need be: 65.09%
- 2 - I am highly flexible on most elements: 17.72%
- 1 - I am totally flexible on everything / have no strong opinions: 3.13%
Where are you getting your wedding inspo?
- Pinterest: 74.70%
- Instagram: 51.39%
- My own creativity: 49.40%
- Other weddings I’ve been to: 40.79%
- TikTok: 33.48%
- Zola: 26.18%
- My vendors: 24.05%
- Google: 18.31%
- Wedding magazines / sites: 17.68%
- From an online community of other engaged couples: 12.28%
- Facebook: 11.82%
- Influencers / Celebrities: 7.70%
- Other: 2.79%
How have you used TikTok in your wedding planning?
- Wedding Inspo: 34.86%
- Mental Break: 23.68%
- Comic Relief: 25.23%
- Follow Engaged Influencers: 12.10%
- Find Vendors: 5.22%
How have you used Instagram in your wedding planning?
- Wedding Inspo: 53.64%
- Mental Break: 29.37%
- Comic Relief: 16.26%
- Follow Engaged Influencers: 11.74%
- Find Vendors: 33.65%
How have you used Facebook in your wedding planning?
- Wedding Inspo: 21.20%
- Mental Break: 14.73%
- Comic Relief: 7.67%
- Follow Engaged Influencers: 4.28%
- Find Vendors: 19.42%
How have you used Pinterest in your wedding planning?
- Wedding Inspo: 71.31%
- Mental Break: 12.26%
- Comic Relief: 3.13%
- Follow Engaged Influencers: 3.88%
- Find Vendors: 7.70%
How has social media impacted your wedding planning?
- Helped me figure out my style / what I’m looking for: 71.82%
- Made me feel even more excited: 47.91%
- Made me want to post my own wedding moments / pics: 28.04%
- Given me a sense of community / made me feel less alone: 23.97%
- Made me dislike trends that I used to like: 19.09%
- Made me feel overwhelmed: 18.66%
- Piled on the pressure to do things a certain way: 13.62%
- Has had no impact: 7.25%
- Other: 1.38%
- I don’t use social media: 1.86%
How are you using social media to share your wedding?
- Engagement post: 67.97%
- Sharing wedding pics after the big day: 63.37%
- Creating a wedding hashtag: 32.92%
- Might share wedding pics for the next 5 years: 29.04%
- Having a phone-free wedding day: 22.79%
- Sharing key moments of the days along our planning journey: 18.13%
- Creating a plan to film videos on our wedding day: 12.75%
- Asking our vendors to capture moments for social: 12.43%
- Sharing live day-of videos or photos: 9.55%
- Incorporating social media pics into our wedding day timeline: 6.96%
- None of the above / I am not using social media to share our wedding journey: 10.13%
What kind of social media content might you create from your wedding day specifically?
- Photos / videos of guests: 66.12%
- Staged / Professional Photos: 56.08%
- Professional wedding video/photo compilation: 55.21%
- Candid / Unaesthetic Photos: 55.15%
- Funny content / bloopers: 21.85%
- Transition TikToks / Reels: 12.15%
- Dance TikToks / Reels: 8.23%
- Other: 0.75%
- I’m not planning to share anything: 7.85%
The Values & Traditions
2023 couples really are having the weddings that they want to have. These couples don’t think of weddings as a chore or an obligation, but as a chance to demonstrate their love for one another in front of those who matter most. They’re focused on creating weddings that are a reflection of the things that are meaningful to them, and throwing a really epic & memorable party for all their family & friends.
What are you most looking forward to after your wedding?
- Getting to experience the rest of our lives together: 46.07%
- Finally being married: 23.67%
- The honeymoon: 12.48%
- Building our home together: 10.22%
- Having it all done with: 3.53%
- Living together: 1.85%
- Other: 1.49%
After you’re married, what will be your biggest priority?
- Buying a home: 26.93%
- Starting a family: 19.46%
- Paying off debts (including student loans): 14.66%
- Saving for travel: 7.08%
- Completing education: 4.58%
- Moving to another city: 3.64%
- Adopting a pet: 1.43%
- Buying a car: 0.77%
- Nothing – just taking a breather to enjoy married life: 19.16%
- Other: 2.29%
In choosing a spouse, how important to you is it that you share the same…values?
- Very important: 89.93%
- Somewhat important: 9.27%
- Not important: 0.80%
In choosing a spouse, how important to you is it that you share the same…religion?
- Very important: 28.97%
- Somewhat important: 34.28%
- Not important: 36.75%
In choosing a spouse, how important to you is it that you share the same…race?
- Very important: 4.44%
- Somewhat important: 11.00%
- Not important: 84.56%
In choosing a spouse, how important to you is it that you share the same…style of upbringing?
- Very important: 19.31%
- Somewhat important: 52.49%
- Not important: 28.20%
In choosing a spouse, how important to you is it that you share the same…political views?
- Very important: 36.21%
- Somewhat important: 46.80%
- Not important: 16.99%
In choosing a spouse, how important to you is it that you share the same…vision for growing your family?
- Very important: 86.56%
- Somewhat important: 11.30%
- Not important: 2.15%
In choosing a spouse, how important to you is it that you share the same…education level?
- Very important: 21.88%
- Somewhat important: 46.53%
- Not important: 31.59%
In choosing a spouse, how important to you is it that you share the same…financial goals?
- Very important: 69.12%
- Somewhat important: 28.64%
- Not important: 2.24%
In choosing a spouse, how important to you is it that you share the same…salary range?
- Very important: 11.59%
- Somewhat important: 51.36%
- Not important: 37.05%
In choosing a spouse, how important to you is it that you share the same…career goals?
- Very important: 40.54%
- Somewhat important: 45.57%
- Not important: 13.89%
In choosing a spouse, how important to you is it that you share the same…sexual compatability?
- Very important: 71.56%
- Somewhat important: 25.81%
- Not important: 2.62%
Why are you having a wedding? (i.e., why are you hosting a celebration of your marriage)
- We want a fun party: 63.11%
- We want to demonstrate our love for each other: 53.57%
- It means a lot to us: 49.15%
- I / we have always dreamed about it: 45.92%
- Our families want us to: 26.67%
- It’s tradition / everyone we know did: 20.63%
- For the spiritual / religious / cultural meaning: 19.37%
- Because society says that’s what you do: 9.12%
- We did not really want to have a wedding: 1.88%
- I don’t know: 1.61%
- Other: 4.04%
If you could change or update one expectation about the wedding journey, which would it be?
- Wedding diet culture: 32.79%
- Balance / assumptions around wedding planning responsibilities: 30.61%
- Name changing / taking partner’s last name: 19.30%
- Being “given away” / walked down the aisle: 19.27%
- Representation of weddings in the media & pop culture: 16.97%
- Gendered wedding parties: 15.11%
- Wearing white: 7.10%
- The proposal process: 6.44%
- The ring: 3.09%
- Other: 4.32%
- Nothing about the wedding journey needs to change: 15.11%
How are you reflecting yourselves and your values through your wedding?
- Having a friend / family member marry us: 50.41%
- Making sure our wedding is an inclusive space: 33.42%
- Having a religion-free wedding: 31.40%
- Memorializing a relative or friend: 28.10%
- Picking a specific theme that is super “us”: 26.76%
- Choosing vendors & businesses who support our values: 21.47%
- Thrifting or sustainably sourcing our wedding look(s) / elements: 19.35%
- Including our pet: 19.13%
- Trying to cut down on waste / be eco-friendly: 16.59%
- Breaking from wedding party gender stereotypes: 15.23%
- Catering that suits our likes / dietary preferences: 15.20%
- Combining our religions / cultural traditions: 14.32%
- Incorporating our children into our celebration: 10.54%
- Giving back to charity in some way: 6.96%
- Wearing non-traditional or unexpected attire: 6.30%
- Dry / alcohol-free wedding: 3.97%
- Other: 2.09%
- None of the above: 5.54%
Are you concerned about any of the following impacting your wedding?
- Public health (COVID, Monkeypox, etc.): 49.82%
- Weather: 49.51%
- Family / friends drama: 39.05%
- Inflation: 36.59%
- Travel issues: 31.04%
- Supply chain issues: 16.25%
- Social issues: 5.58%
- International relations: 4.91%
- Other: 0.58%
- None of the above: 9.97%
The Finances & Budget
While inflation has impacted the economy, wedding budgets continue to remain the same, which means couples are getting smart about where and how they’re using their money – from optimizing credit cards to adding wedding decor cash funds to registry, and really focusing on prioritizing where they’re willing to splurge.
What is your wedding budget?
- $5,000 or less: 5.10%
- $5,000 - $10,000: 10.94%
- $10,000 - $15,000: 11.97%
- $15,000 - $20,000: 13.27%
- $20,000 - $30,000: 17.74%
- $30,000 - $40,000: 11.18%
- $40,000 - $50,000: 9.17%
- $50,000 - $75,000: 8.96%
- $75,000 - $100,000: 3.80%
- $100,000 or more: 3.46%
- Prefer not to answer: 4.40%
How large is your guest list?
- We are eloping: 0.46%
- <10: 0.27%
- 10-30: 1.94%
- 30-50: 5.29%
- 50-75: 9.21%
- 75-100: 16.35%
- 100-150: 31.39%
- 150-200: 23.15%
- 200-300: 9.85%
- 300-500: 1.82%
- 500+: 0.27%
Who is paying for your wedding?
- My parents / in laws - in part: 32.5%
- My parents / in laws - in full: 9.4%
- Friends - in part: 1.5%
- Friends - in full: 0.13%
- Other relatives - in part: 6.1%
- Other relatives - in full: .2%
- My partner & I - in part: 33.6%
- My partner & I - in full: 16.6%
How are you paying for your wedding?
- We are optimizing credit cards (including using points, taking out new credit cards, etc.): 28.69%
- I/We saved up for years before getting engaged: 25.86%
- I/We have taken second or third jobs: 12.35%
- Adding wedding elements to registry (photographer fees, etc.): 5.91%
- We have taken out a loan: 3.72%
- Crowdsourcing/funding: 2.26%
- We are able to afford our wedding, but none of the above apply: 49.27%
- Other: 8.80%
What elements are you most willing to splurge on?
- Photographer: 52.62%
- Venue: 39.25%
- Open bar: 35.60%
- Catering: 28.71%
- Attire (wedding dress, suit, shoes, etc.): 26.52%
- Music: 18.67%
- Videographer: 11.91%
- Reception experiences (photo booth, ice cream truck, champagne wall, etc): 11.51%
- Flowers: 11.14%
- Hair & Makeup: 8.22%
- Decor: 6.85%
- Wedding planner/coordinator: 5.79%
- Venue rentals (table linens, chairs, etc.): 4.08%
- Cake: 2.38%
- Other: 0.88%
- None of the above: 1.64%
Do you have or are you planning to have any cash funds on your registry?
- Yes: 80.57%
- No: 19.43%
What are you using your cash funds for?
- Honeymoon / travel: 84.38%
- To purchase a home or move to a new home: 33.17%
- To help pay for our wedding: 23.83%
- Home renovations / upgrades: 18.49%
- To pay down other debt: 10.97%
- For special date nights: 8.85%
- To pay for education or pay back student loans: 5.67%
- For family planning (i.e. fertility treatments, adoption, etc.): 4.27%
- For our pet or future pet: 3.21%
- Charity: 1.97%
- To fund a hobby: 1.70%
- Other: 2.16%
Methodology:
__Survey of 4,249 Zola couples with wedding dates throughout 2023 from across the US conducted in August 2022. __
Up next for you
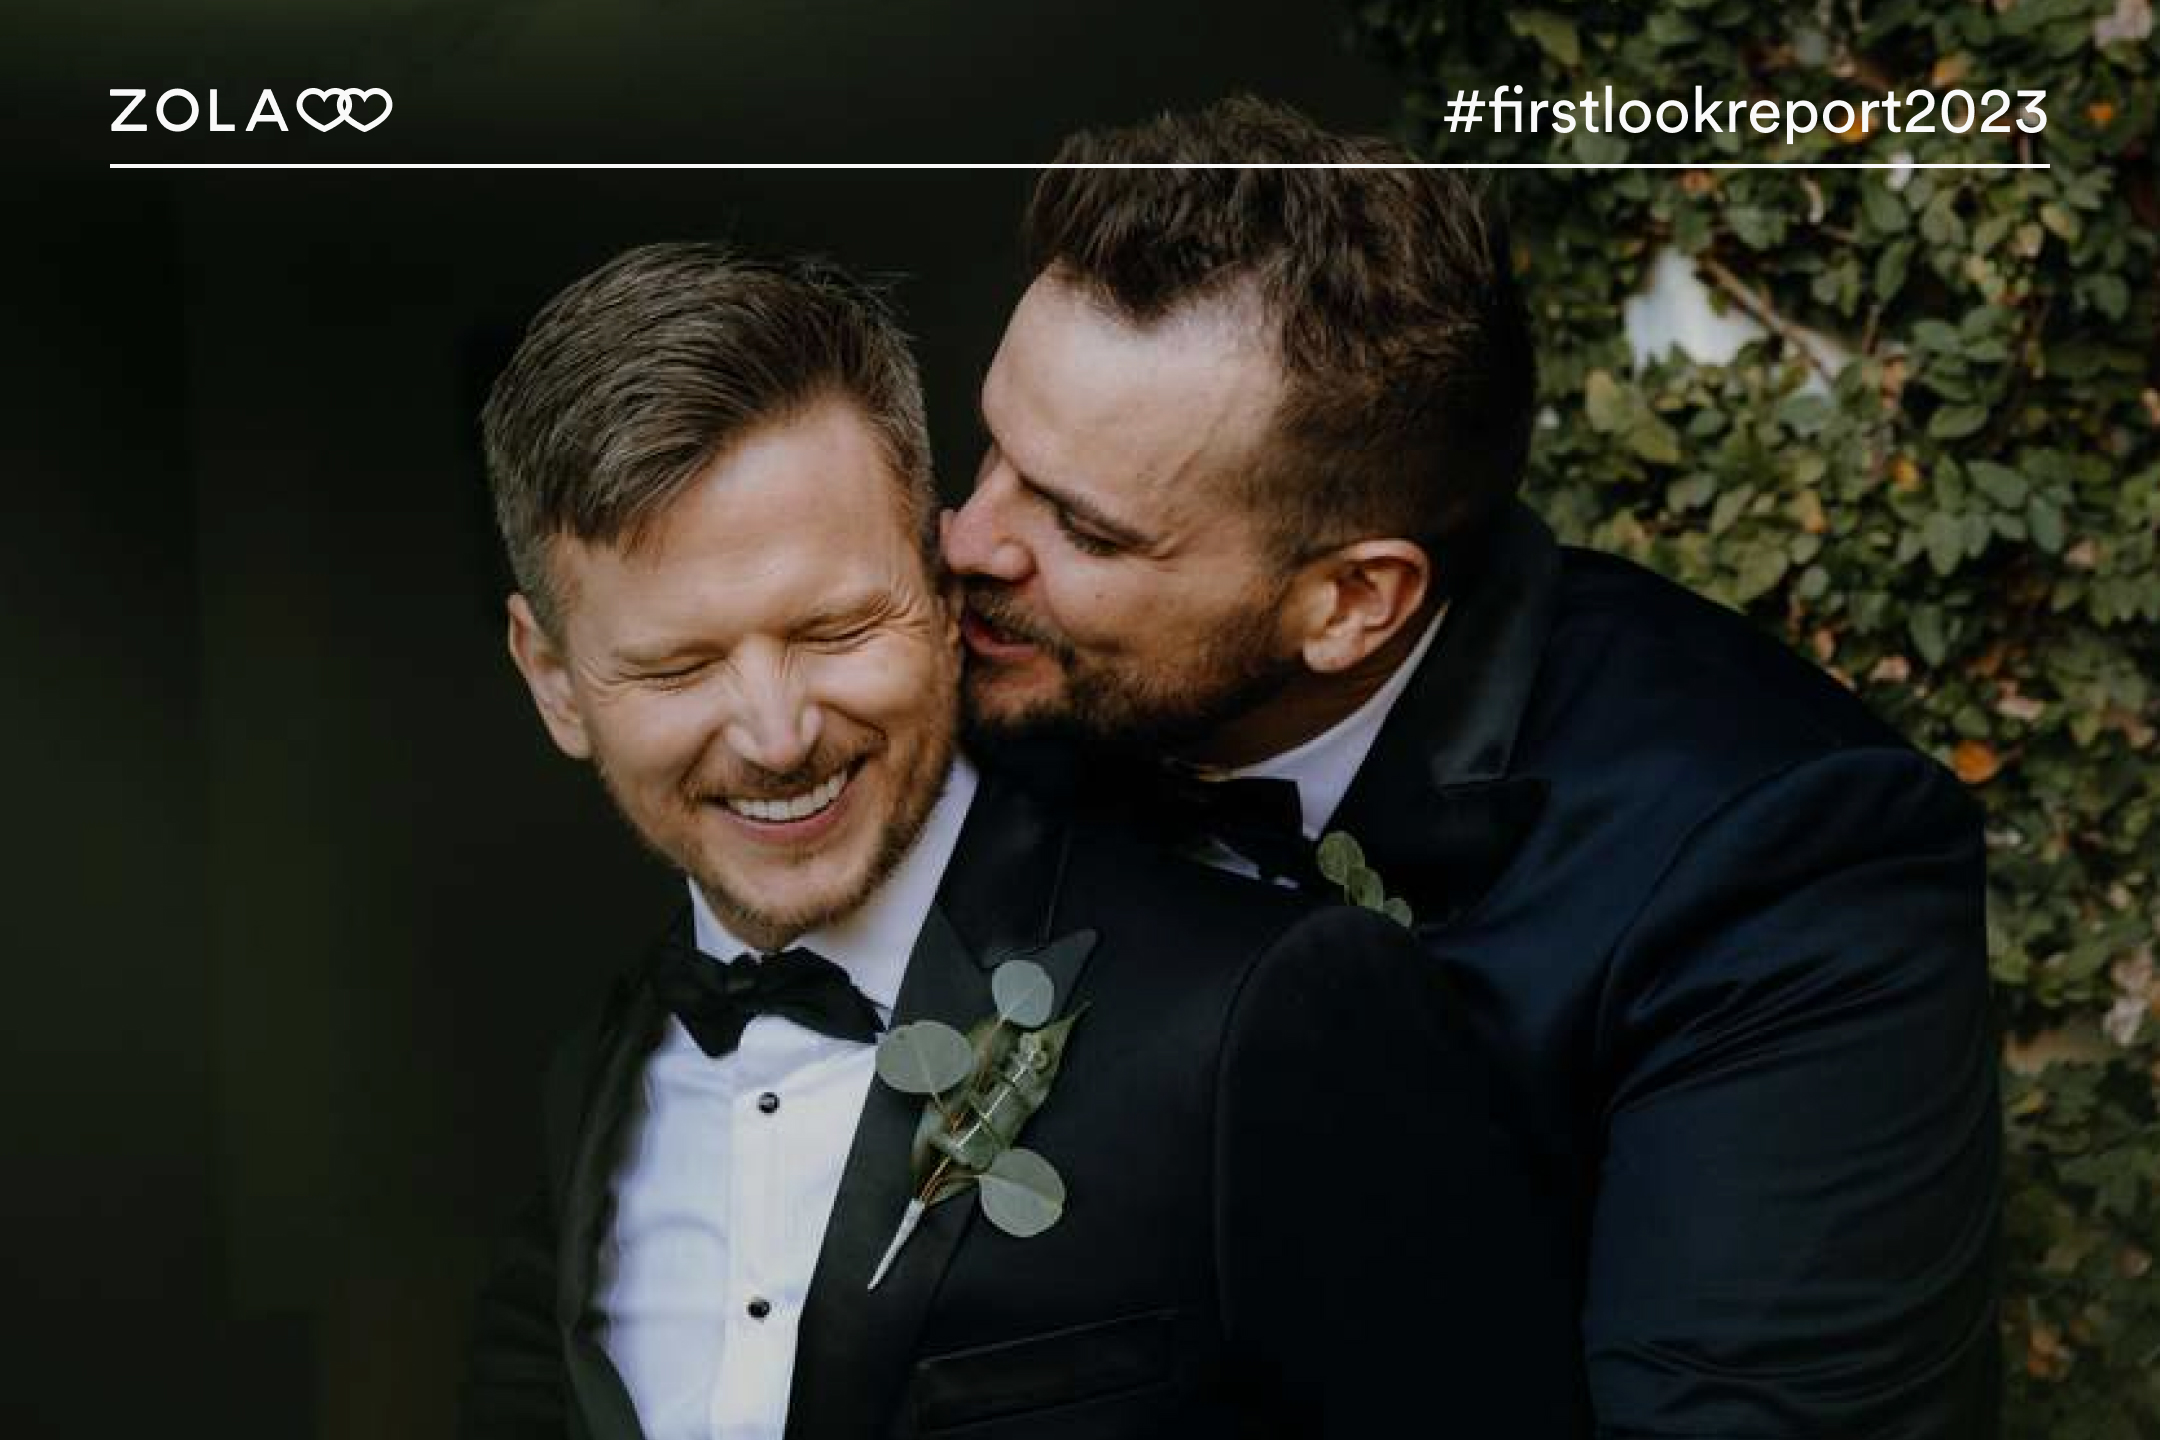
The First Look Report 2023
Inspiration
Zola’s annual guide to wedding trends and budgets. Here's what's new in 2023...
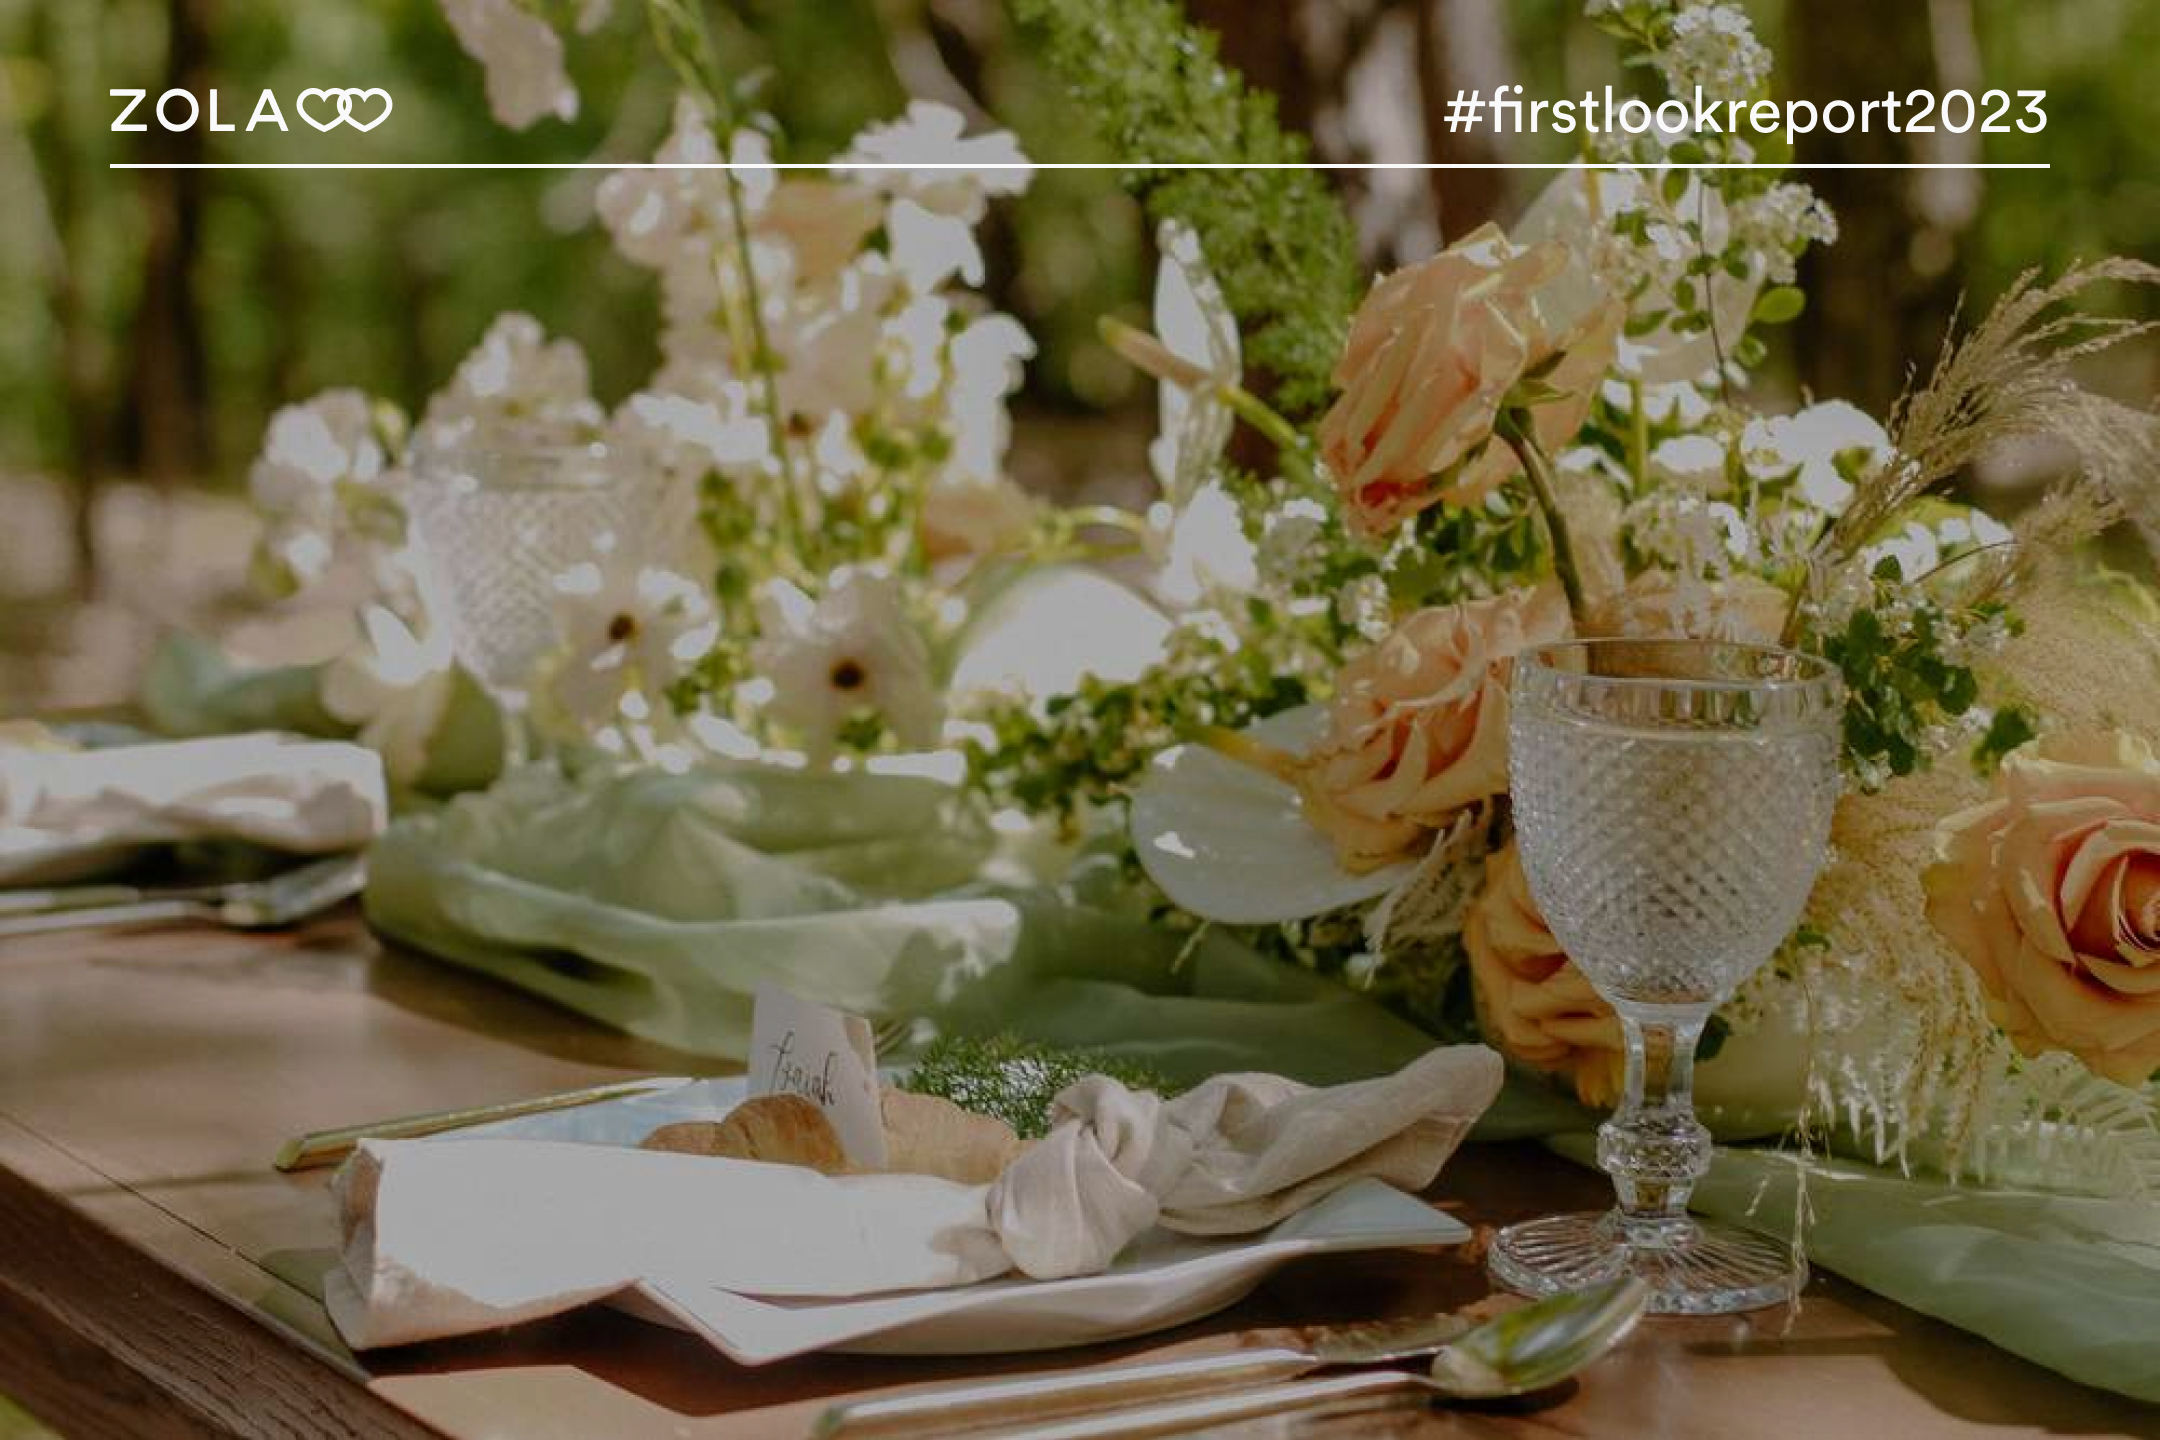
How to Organize All Your Wedding Inspo—From TikTok, Instagram, Pinterest, and More
How To
Wondering what to do with the 1000+ wedding posts you've saved all across the web? We're bringing you a complete social media guide to organizing all your wedding inspo, plus tips for creating your own content on your wedding day.
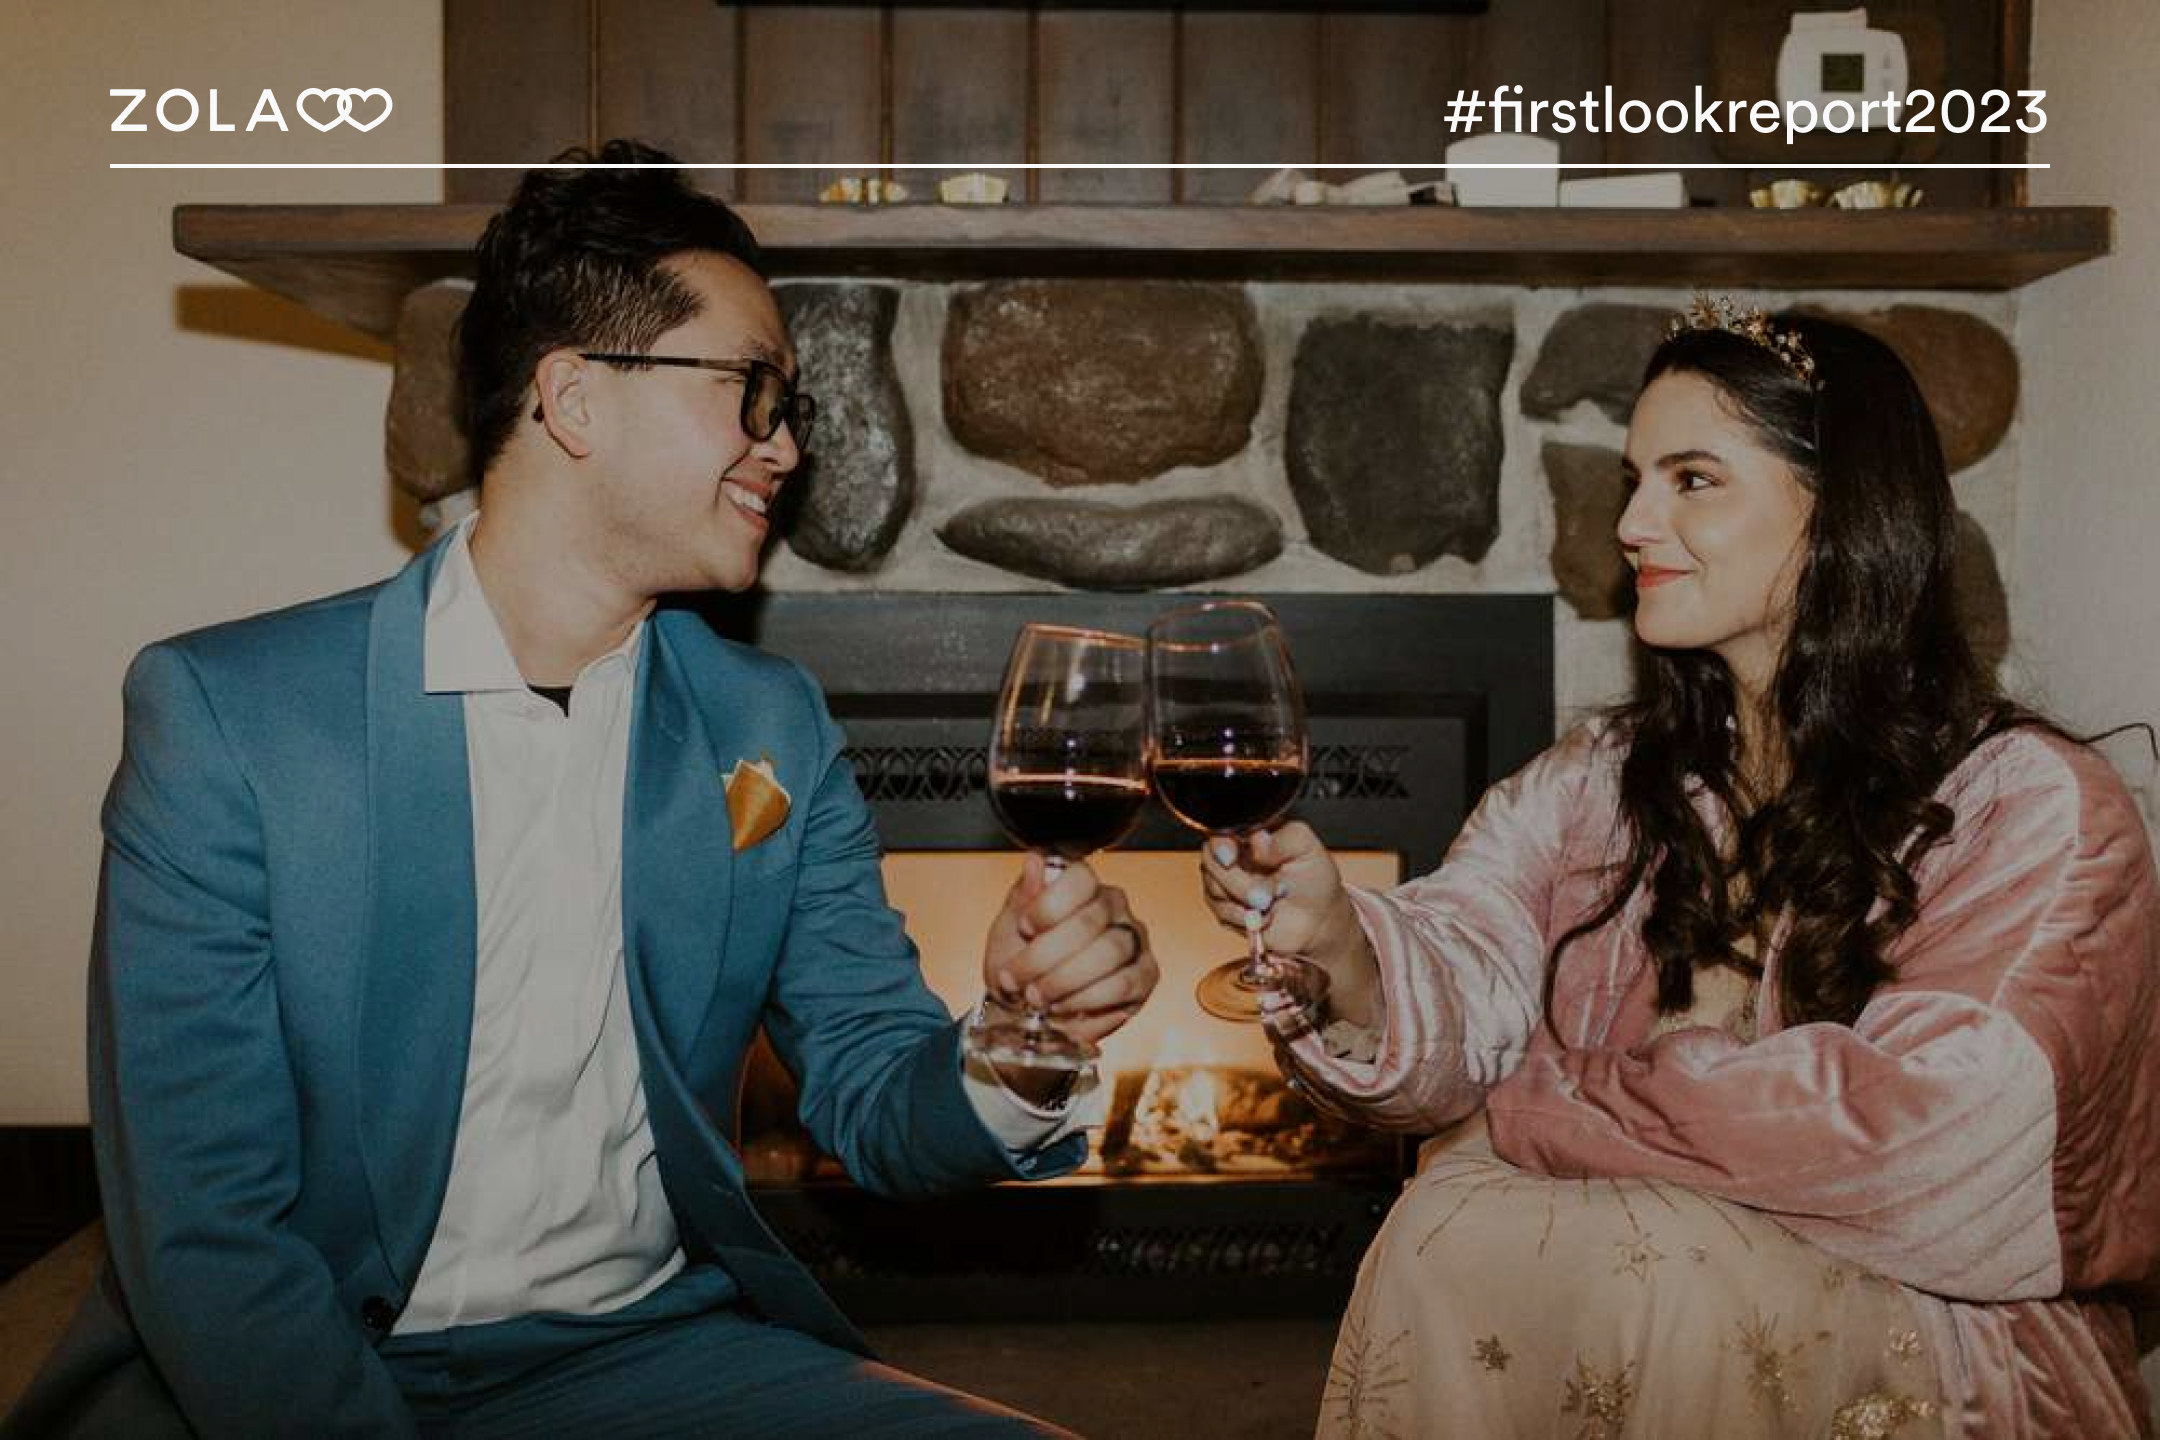
Ways to Celebrate All Your Wedding Planning Milestones
How To
Planning a wedding is about more than just the wedding day—there are many moments along the way that couples also enjoy and celebrate. Here are the best parts of wedding planning, including ideas for making these milestones extra special.
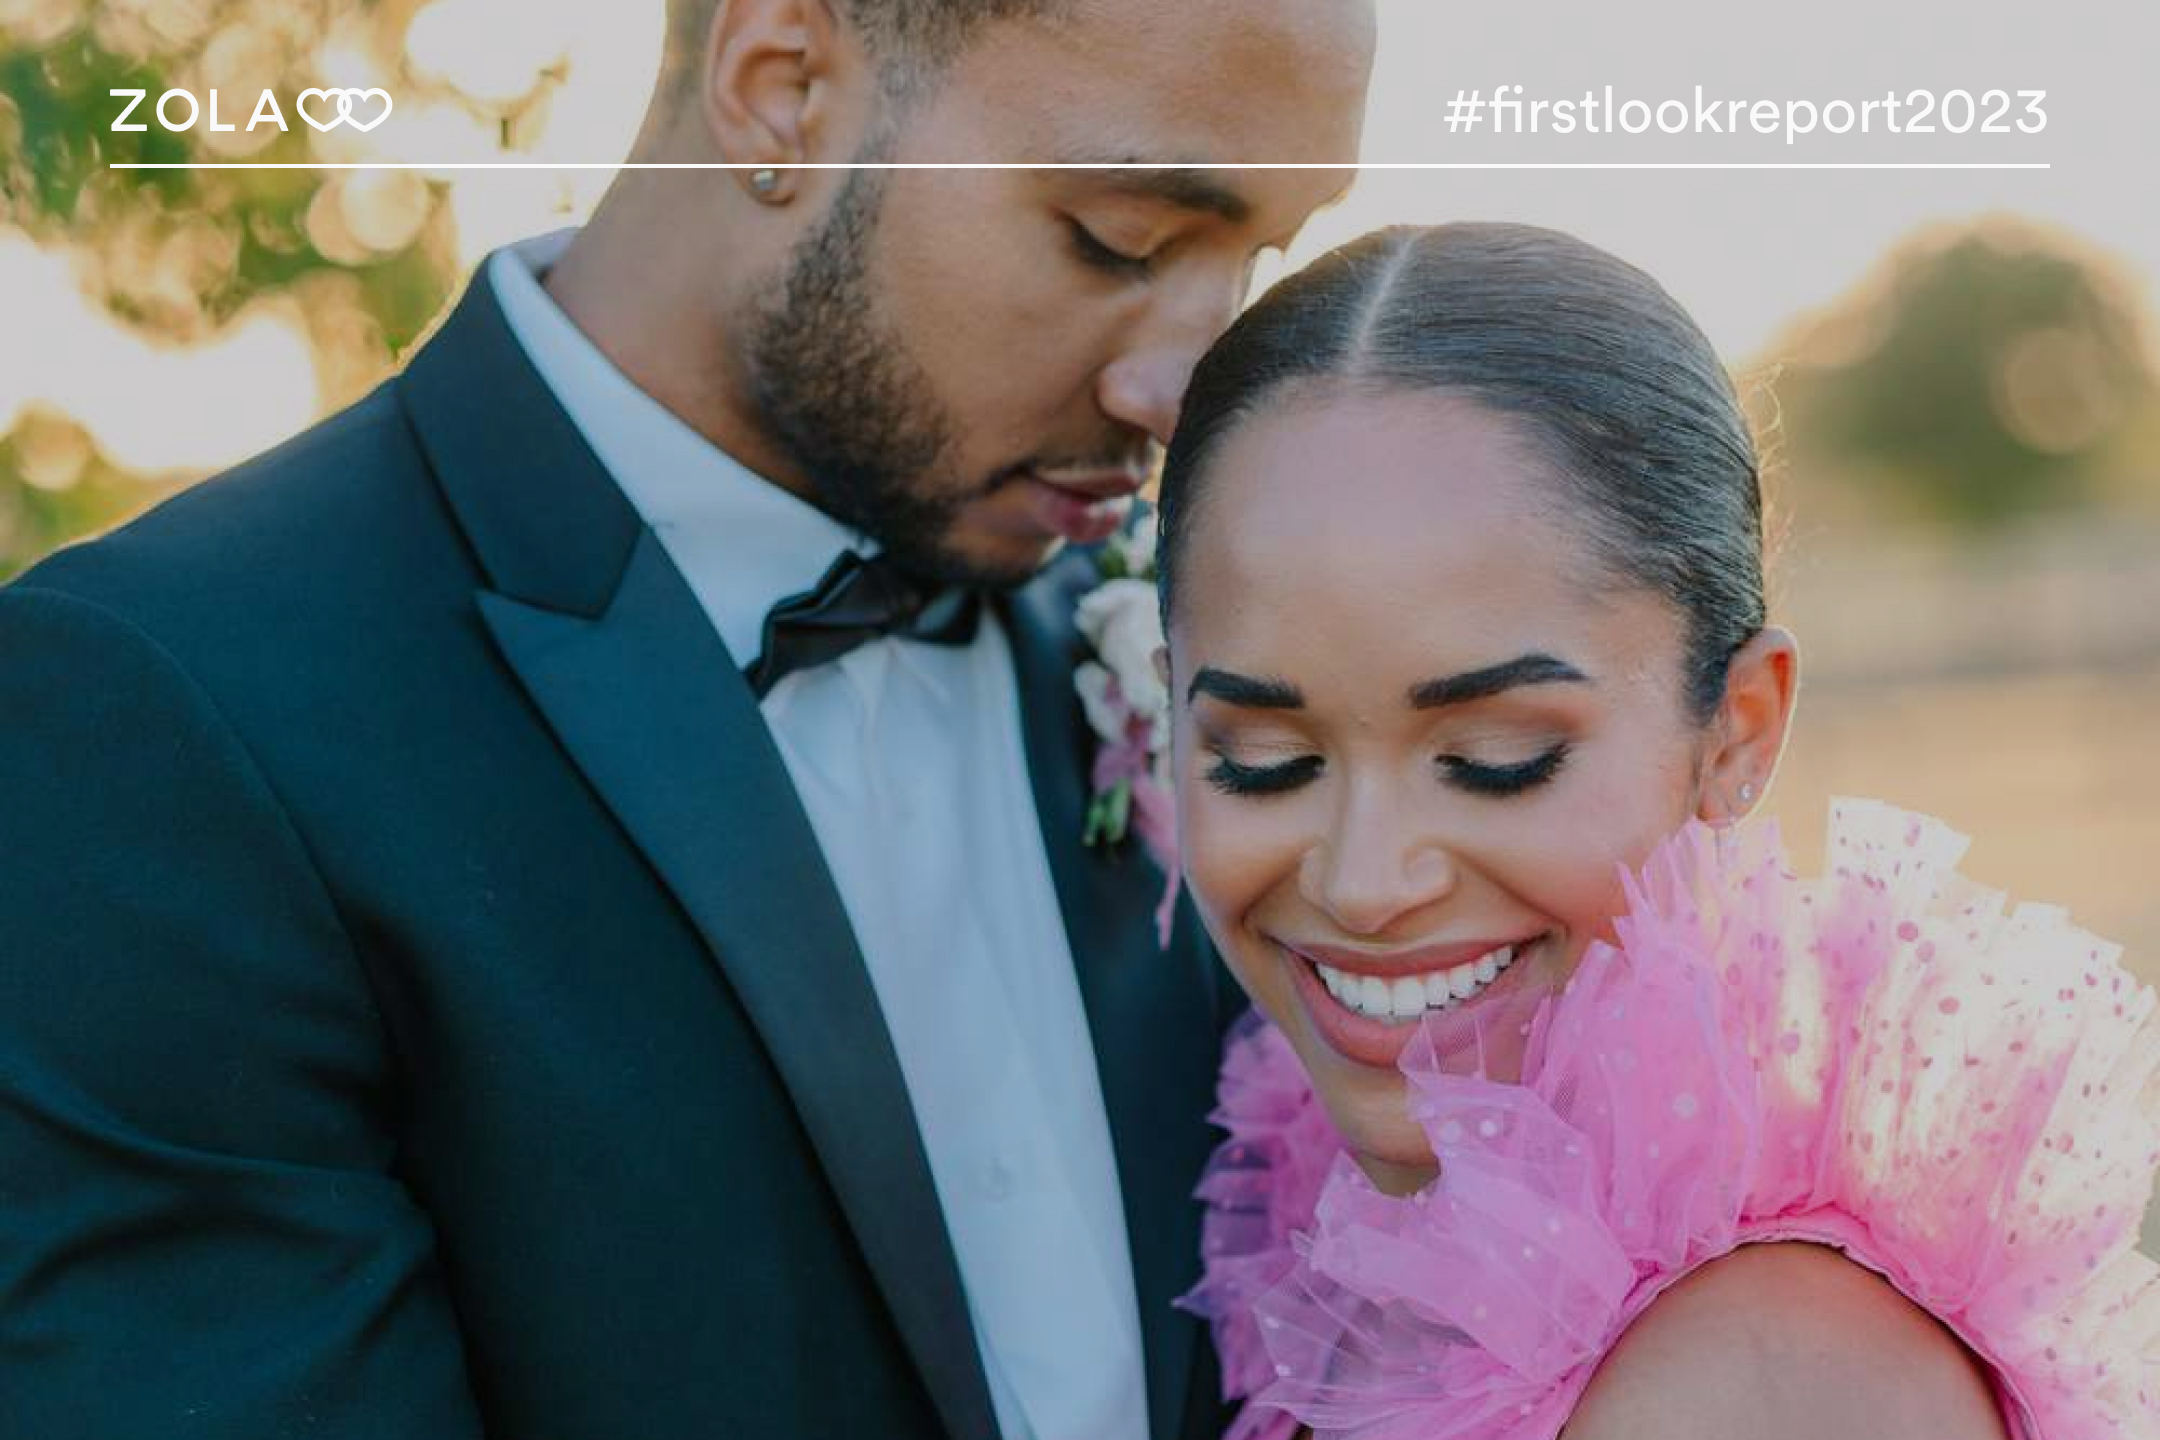
The Best Parts of Wedding Planning, According to Real Couples
List
Planning a wedding can feel like a rollercoaster, so we asked 2023 engaged couples to share the best parts of making it to the big day
- Expert advice/
- Wedding trends/
- First Look Reports/
- The First Look Report 2023 Deep Data Dive
Find even more wedding ideas, inspo, tips, and tricks
We’ve got wedding planning advice on everything from save the dates to wedding cakes.
